Introduction
This project was born from Rush’s Medical Center development of the same project which was implemented using Jupyter Notebook & hosting it on a virtual machine using Voila.
Rush’s Medical Center calculates forecasting based on 3 models:
- Exponential Regression
- Logistic Regression
- Polynomial Regression
Deploy to Azure
To deploy this solution to Azure click here to access the GitHub repository with detailed instructions and source code. Feel free to take this solution and customize it to your needs or enhance it as you see fit.
Problems to Solve
- The solution architecture is not scalable, it was deployed using Azure VM Scale Sets
- Juniper Notebooks are great to develop and test models but not to release them to production, every time a request was made to the application, the entire notebook is executed
- Expected user experience was clunky
Server-less Solution Architecture
Server-less Architecture Advantages
- Scalable – auto-scaling can handle increased load.
- Micro-services Design – Independent modules that communicate with each other using well-defined API contracts. These service modules are highly decoupled building blocks that are small enough to implement a single functionality.
- Affordable – starting at $200 a month
Component Overview
 Front end
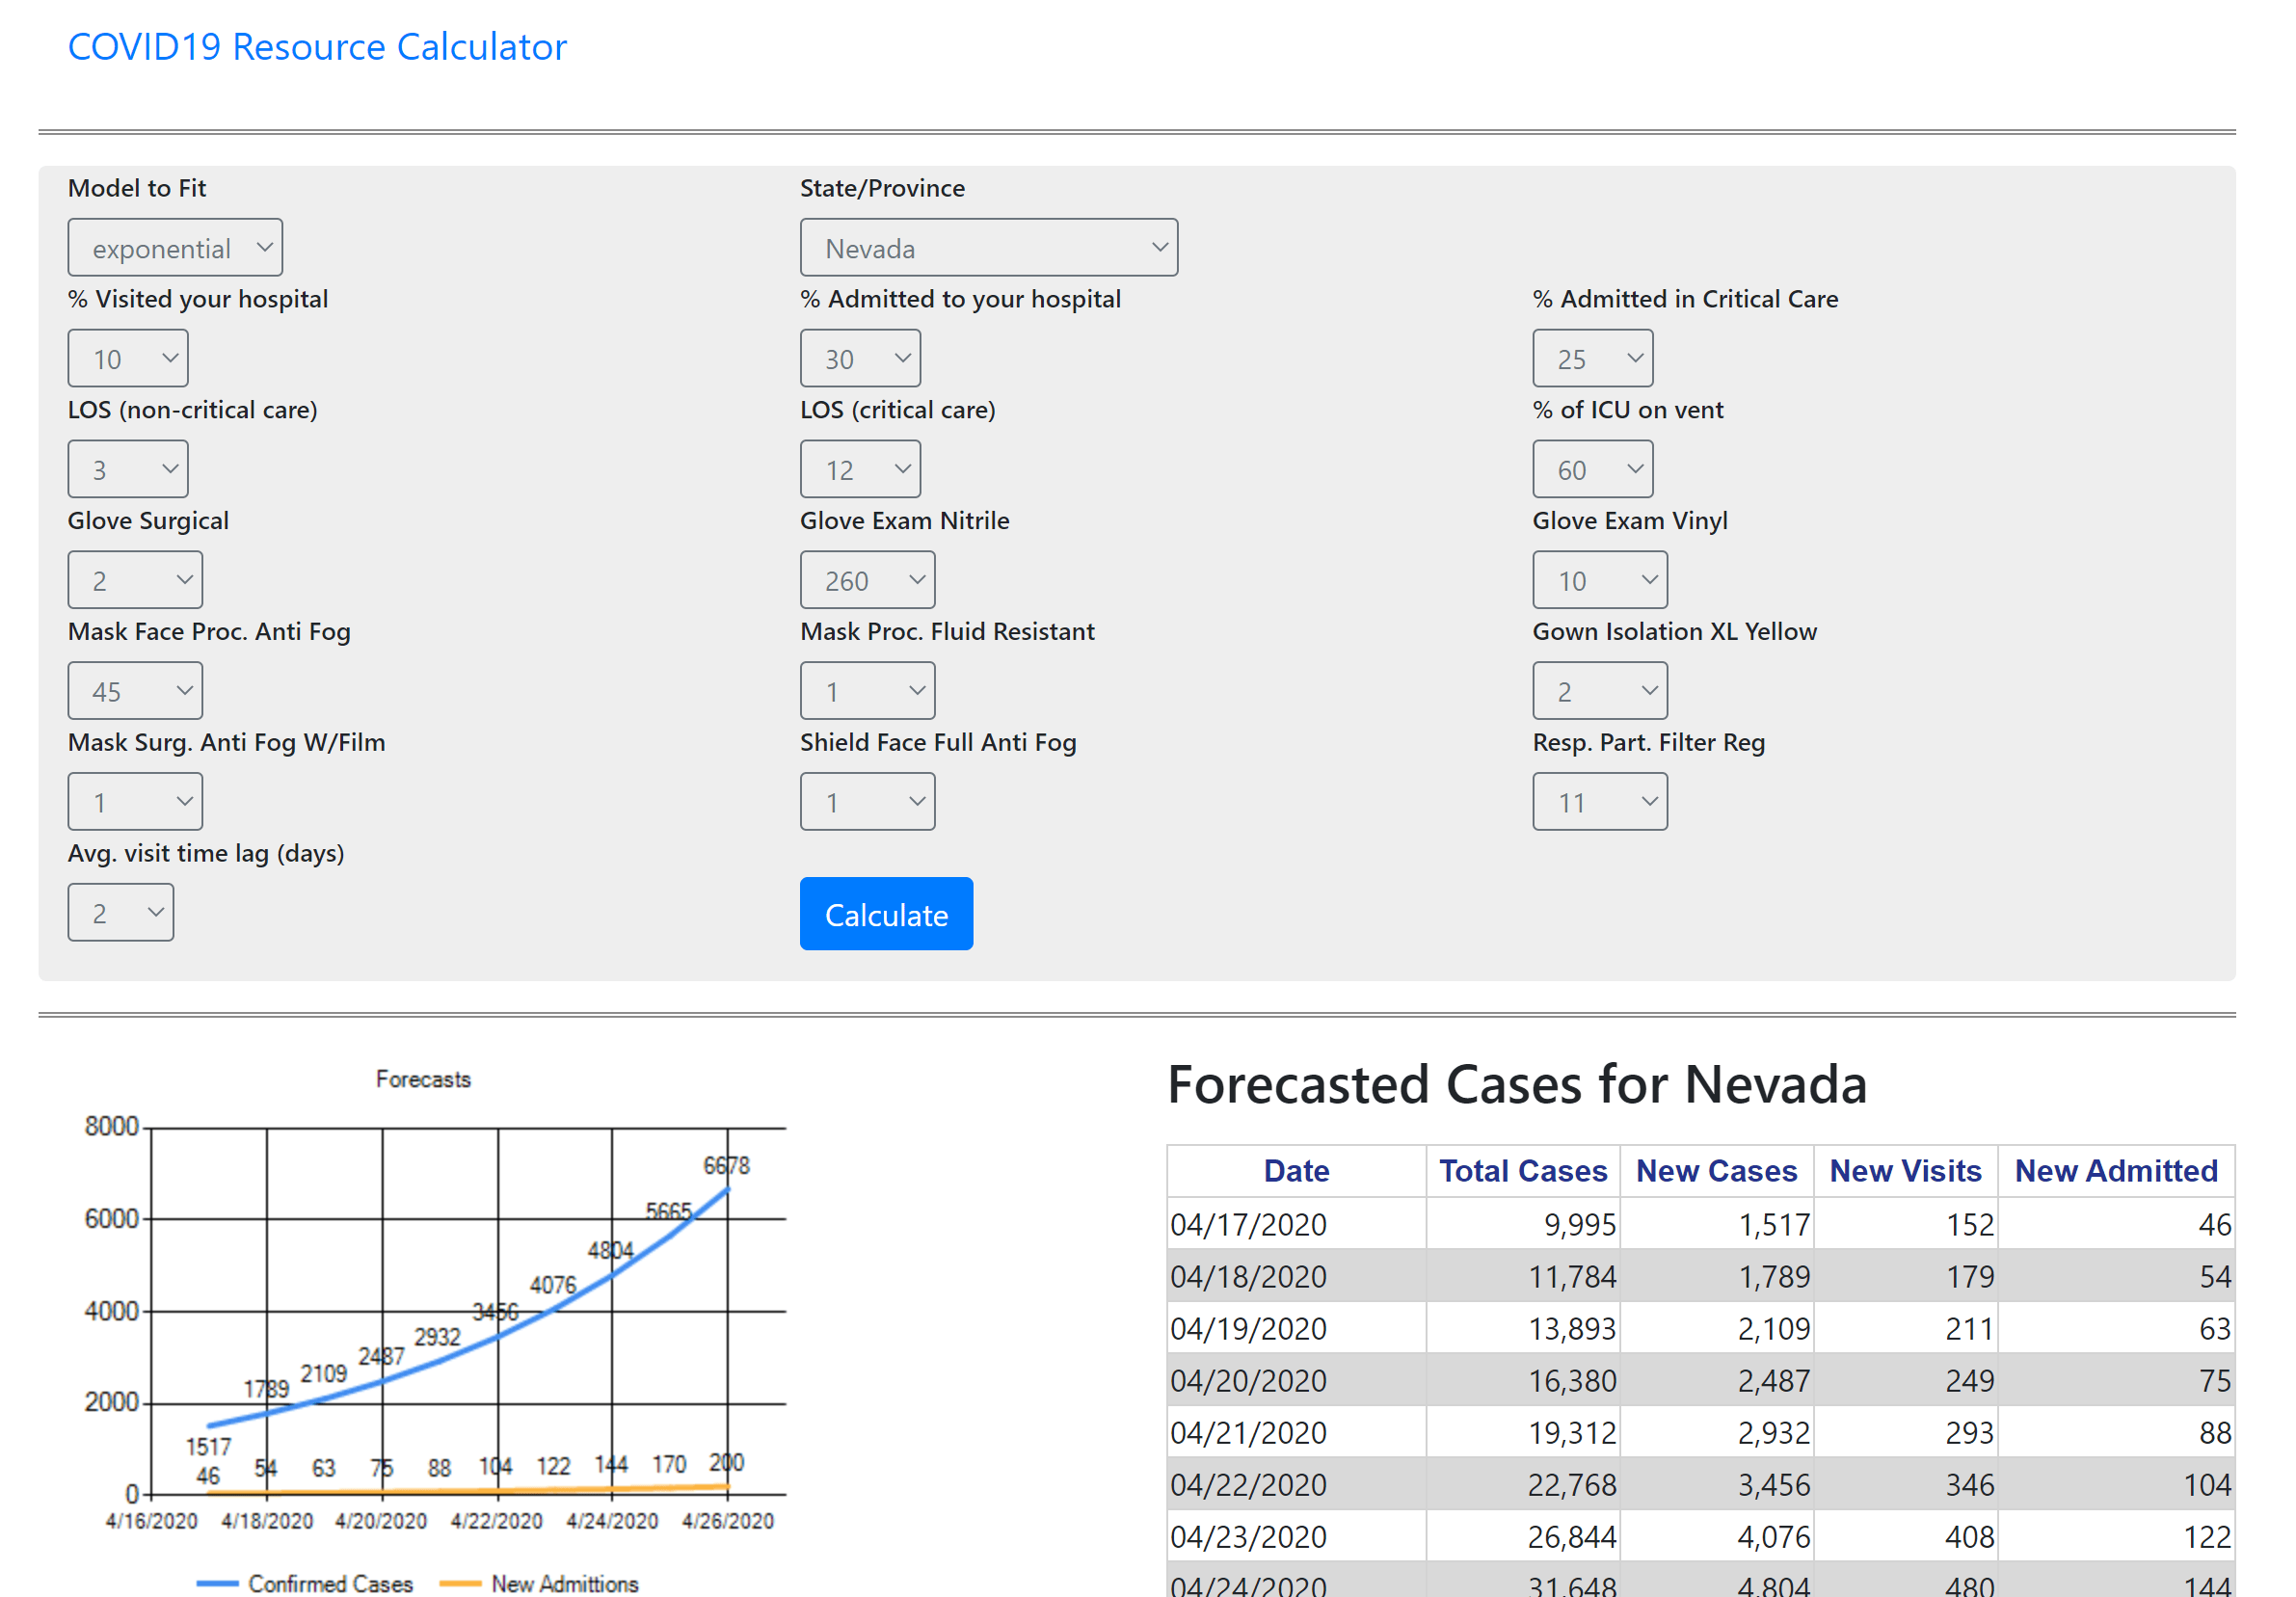
- https://covid19peeforecasting.azurewebsites.net/
- This is the front-end application for users. This is a C# – ASP .NET application, using out of the box components
- Windows based App service
- Scalable
- Integrated with Application Insights

 Azure Functions
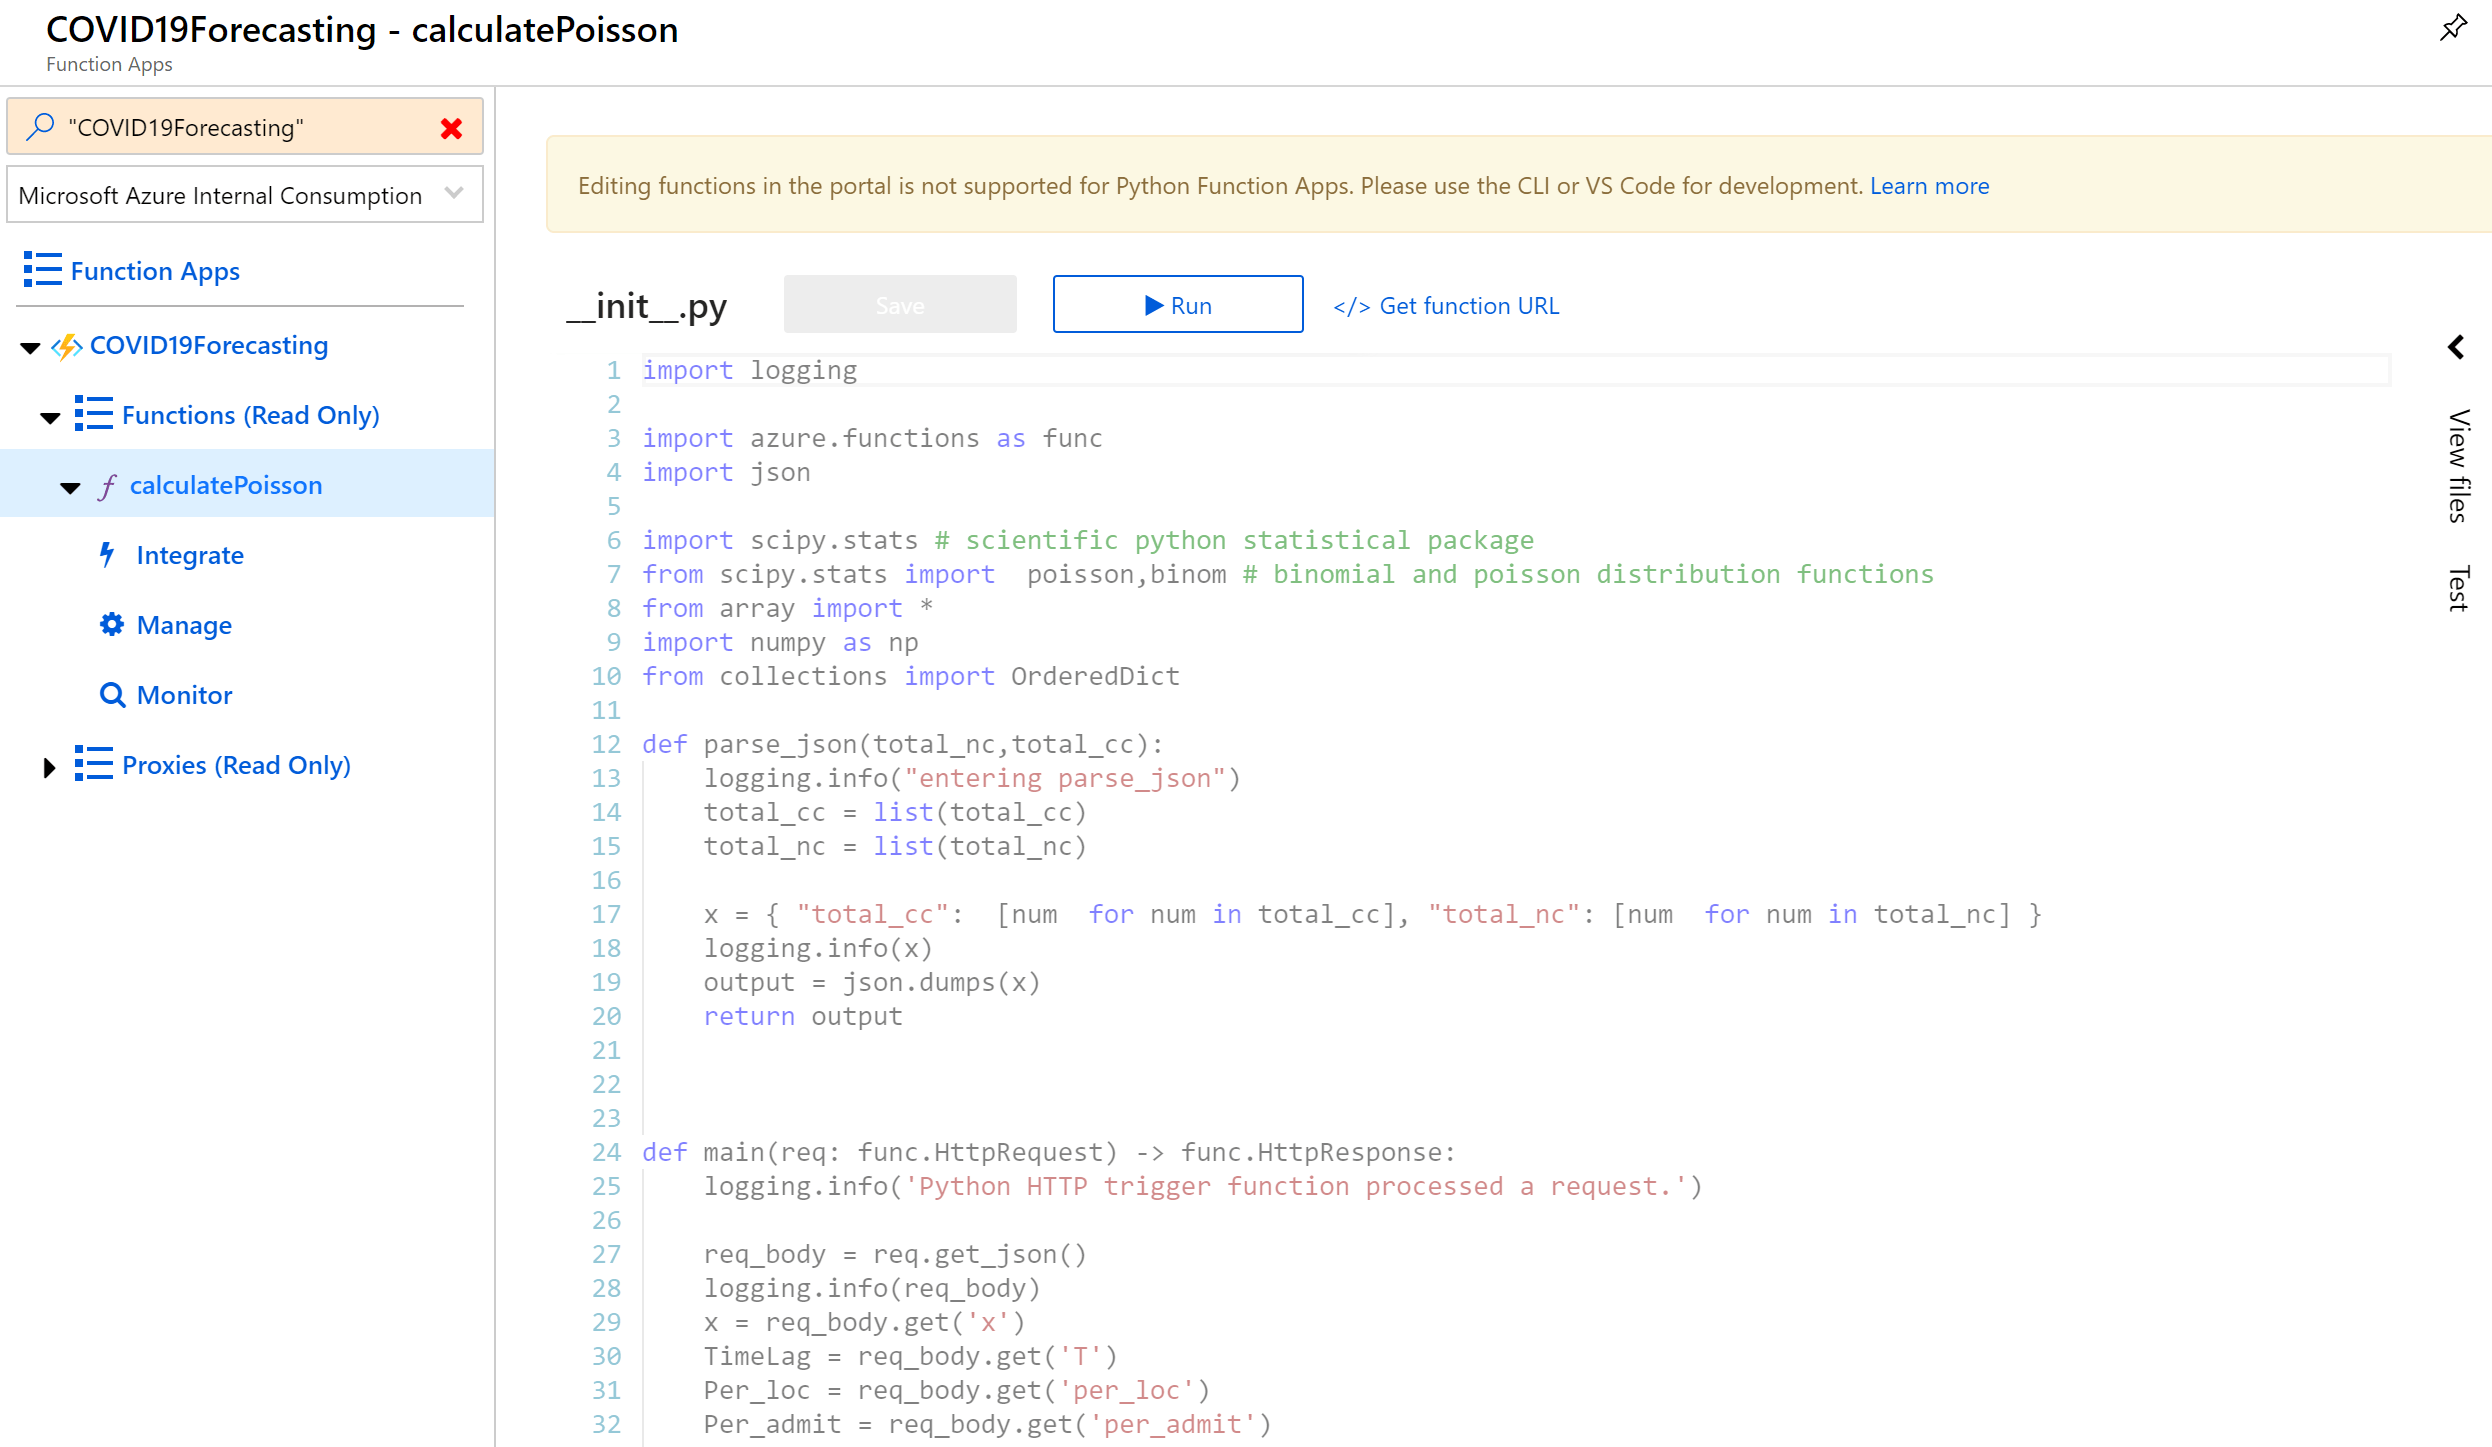
- Python-based Azure Function that runs statistical calculations for PPE forecasting based on user selected parameters in the Front-End application
- This is a Linux Based App Service – Premium Service Pricing model
- Scalable
- Integrated with Application Insights
 Azure Data Factory
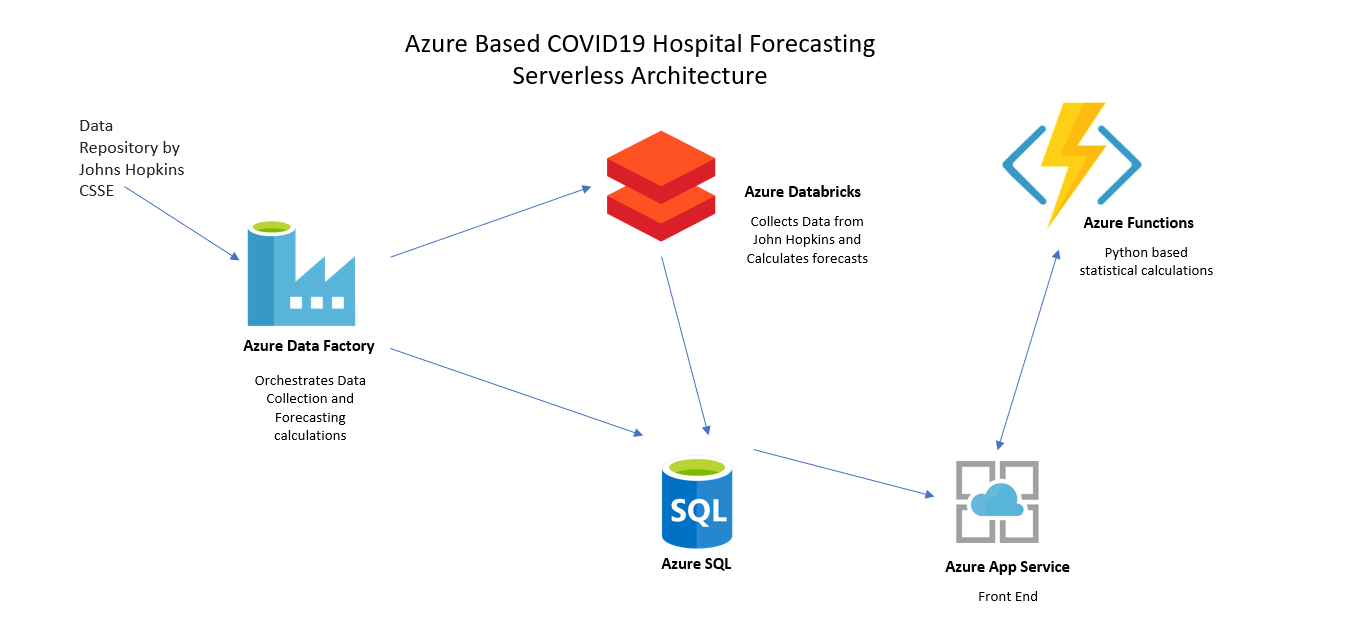
- Orchestrates the ingestion and processing of daily COVID-19 confirmed cases data collected and provided by John Hopkins University
- The pipeline clears the staging table that holds data to be processed, calls an Azure Databricks that reads data from John Hopkins, parses daily information per estate and then generates the forecasting calculations, saves them to SQL server, then a stored procedure is called to calculate new cases and save the fresh data into the COVID19Forecast Table.
- Triggers scheduled to run every day at 5:00 am run the pipeline automatically

 Azure SQL Single Database – Server-less
- Server-less Azure SQL databases charges you for the storage space used by your database and the compute time only, making it a very affordable option.
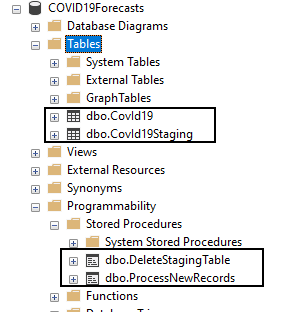
- The database contains to tables: COVID19 and CoVID19Staging.
- There are 2 stored procedures: DeleteStagingTable (self explanatory) and ProcessNewRecords, this stored procedure truncates the COVID19 table, inserts the new records and calculates new cases.
- Separation between the two tables is due to indexing on COVID19 for faster searches
 Azure DataBricks
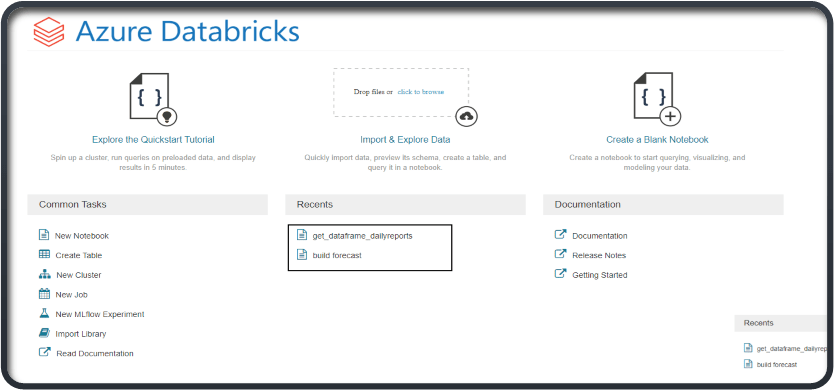
This workspace contains two python-based notebooks:
-
- get_dataframe_dailyreports: this notebook aggregates data from John Hopkins University and creates a temporary file to be used for forecasting
- build forecast reads the temporary file and calculates forecasting values for every US state for 3 models:
- Exponential Regression
- Logistic Regression
- Polynomial Regression